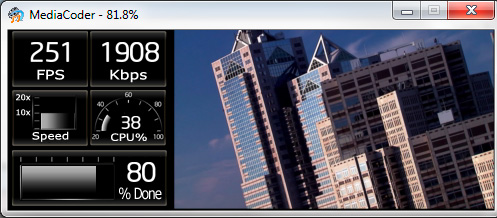
For people who loves transcoding (like me), they like to watch the progress of their transcodings. So why not make the progress look cooler. A year ago, I was developing a dashboard software for my car. That piece of software wasn’t getting famous like MediaCoder. Fortunately my work wasn’t all wasted. Today I moved my dashboard rendering engine into MediaCoder. A new preview mode named Dashboard mode was added, in which, a dashboard with some live statistics will be shown side by side with the video frame being transcoded.
For people happen to be interested in making their own dashboard, here is some related information.
The look of dashboard is defined with an XML named dashboard.xml located in the dashboard folder of MediaCoder’s installation folder. Besides the XML file, there are a bunch of image files in the folder which are loaded to compose the dashboard and implement animation of some gauges and meters. The content of the XML file is like this:
<?xml version="1.0" ?>
<dashboard>
<screen width="160" height="176" color="32"/>
<!--FPS meter-->
<rect x="1" y="1">
 <image x="0" y="0" src="fps.png"/>
 <digits pid="1002" min="0" width="3" src="num_big.png" x="20" y="11"/>
</rect>
<!--bitrate meter-->
<rect x="80" y="1">
<image x="0" y="0" src="bitrate.png"/>
<digits pid="1006" min="0" width="4" src="num_big.png" x="12" y="11"/>
</rect>
<!--speed gauge-->
<rect x="1" y="60">
 <image x="0" y="0" src="speed.png"/>
 <gauge pid="1003" min="0" max="20">
 <image x="31" y="8" src="meter_bar.png" tile="45"/>
</gauge>
</rect>
<!--CPU load gauge-->
<rect x="80" y="60">
 <image x="0" y="0" src="cpu_load.png"/>
 <gauge pid="1100" min="20" max="100">
  <image x="13" y="14" src="gauge_bar.png" tile="41"/>
 </gauge>
 <digits pid="1100" width="3" min="0" max="100" src="num_small.png" x="23" y="26"/>
</rect>
<!--Progress Meter-->
<rect x="3" y="120">
 <image x="0" y="0" src="progress.png"/>
 <gauge pid="1001" min="0" max="100">
  <image x="10" y="16" src="progress_bar.png" tile="50"/>
 </gauge>
 <digits pid="1001" width="3" src="num_big.png" x="100" y="12"/>
</rect>
</dashboard>
Let me try to explain a little bit.
<rect> is used to define a rectangle area with a given left and top coordinate s on the screen. All the coordinates inside the <rect></rect> will be based on that coordinates.
<image> is used to load and display an image on the given position. It has following attributes:
- src – load the specific image file
- x/y – coordinates of left/top corner
<digits> is used to show a numeric data on the given position. It has following attributes:
- pid – parameter identification number used to specify actual data to be displayed
- width – specifies the number of digits that will be displayed
- src – load the specific image file as font image
- x/y – coordinates of left/top corner
<gauge> is used to show a gauge or meter with animation. It has following attributes:
- pid – parameter identification number used to specify actual data to be displayed
- src – load the specific image file which will be splitted horizontally and mapped into different data values
- tiles – number of tiles to be splitted into
- min/max – the minimum and maximum value of data, used to calculate which pile of image to be displayed
- x/y – coordinates of left/top corner
